


"Swim Inflation in India: Are We Racing Toward Progress or Sinking in Stagnation?"
The Data Behind the Dive

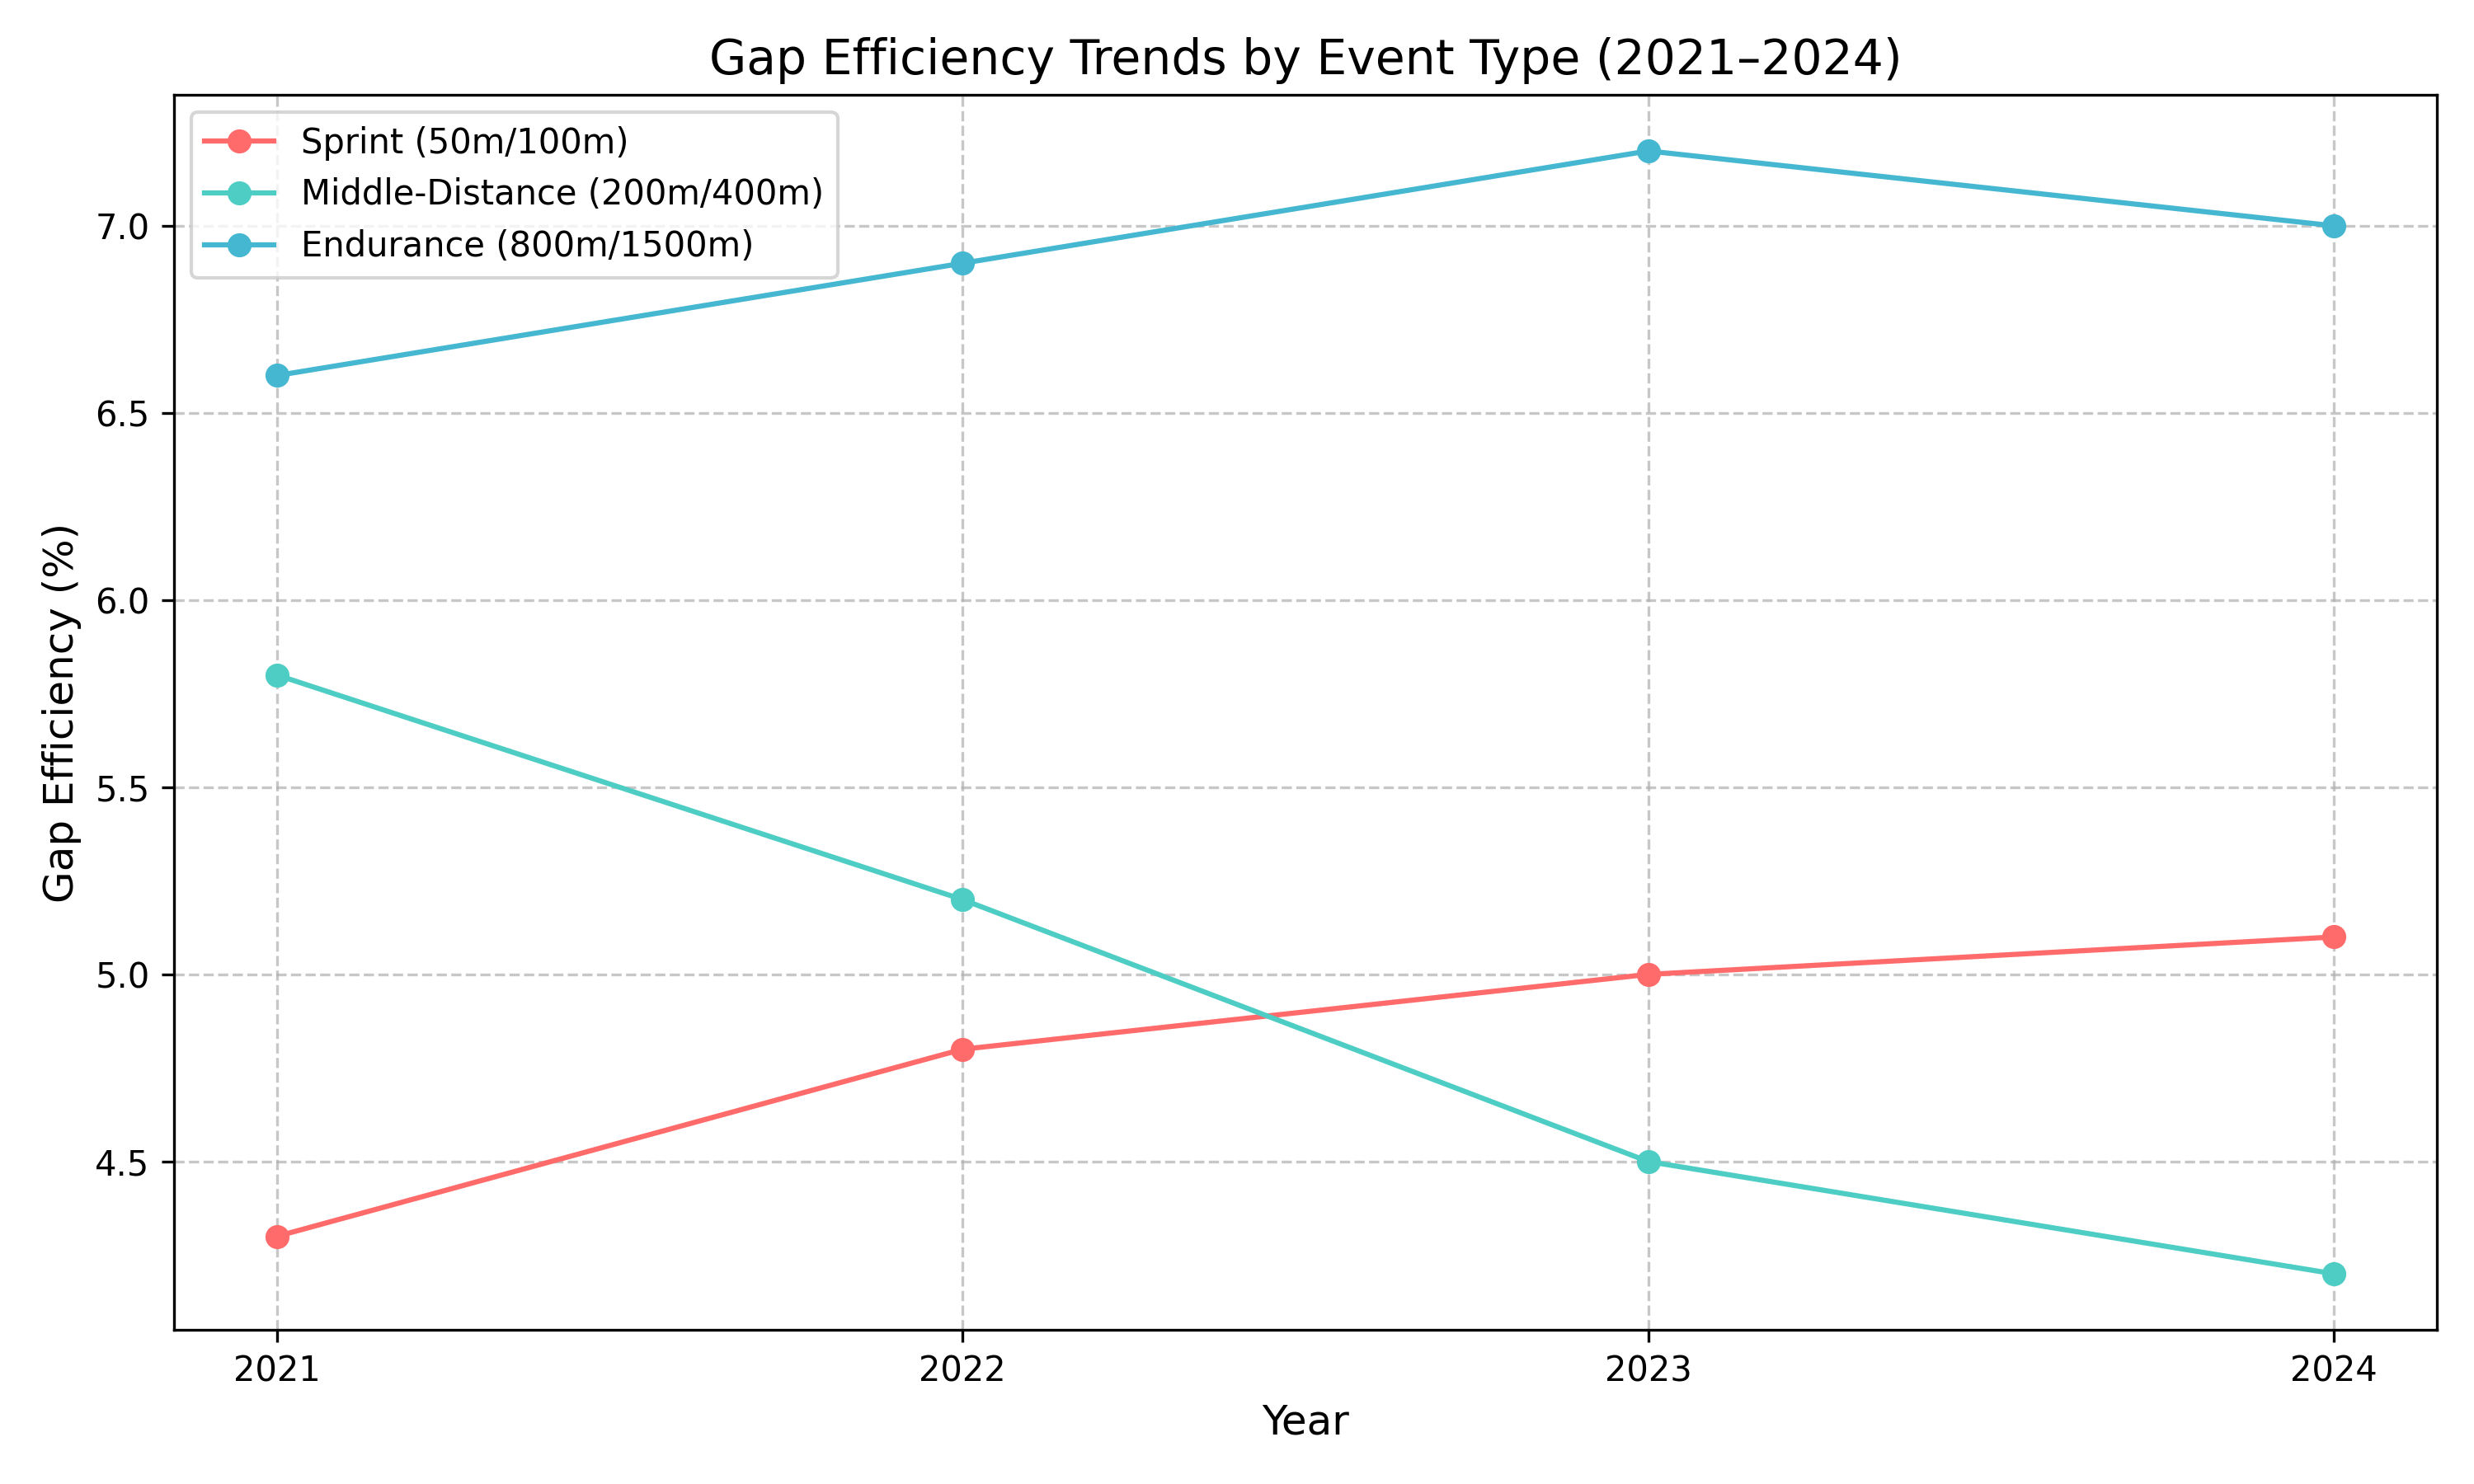
In the last decade, Indian competitive swimming has quietly been going through a revolution. With data across national championships (2021–2024), I looked at gap efficiency (normalized time gaps per 100m) alongside year-over-year (YoY) gap changes to answer the pressing question: Is the competition tightening, or are elites pulling away from the competition?
What Is “Swim Inflation”?
Swim inflation is the change in the gap between elites (1st place) versus their competitors (8th place). (“Positive inflation” is a shrinking gap, which means increasing competition; “negative inflation” is a widening gap, which indicates domination by a few.) But how do we quantify this?
Metric 1: Gap Efficiency (%)
Purpose: Compare competitiveness across various disciplines.
The fact that a 3 sec gap between 1st and 8th place is catastrophic while the same gap in a 1500m endurance race is negligible.
Why It Matters:
Lower % = Tighter the competition.
Enables direct comparison between sprints (50m) and endurance races (1500m).

Example:
Men’s 100m Freestyle (2021):
1st: 49.94s | 8th: 53.91s
Gap = 53.91−49.94=3.97s53.91−49.94=3.97s
Gap Efficiency = 3.97100×100=3.97%1003.97×100=3.97%.
Translation: For every 100m, the 8th-place swimmer lagged by ~4 seconds.
Metric 2: YoY Gap Change (%)
Purpose: To follow progress/regression over time.
Year over year (YoY), are gaps narrowing or widening? Its metric compares gaps to a baseline year (2021).
Why It Matters:
Negative % : Gaps closing(good).
Positive %: Gaps widening (bad)

Example:
Women’s 200m Butterfly (2024 vs. 2021):
2021 Gap: 6.93s | 2024 Gap: 6.95s
YoY Change = 6.95−6.936.93×100=+0.2%6.936.95−6.93×100=+0.2%.
Translation: Gaps widened slightly (+0.2%), signaling stagnation.
What the results demonstrate is a paradox: that while India is on the rise in technical and middle-distance events, systemic problems loom over its progress in endurance-based events and in gender equity that threaten its long-term success. Let’s dive in.
The Sprint Paradox: Speed ≠ Competitiveness
Key Metric: Gap Efficiency (%)-Normalized gap per 100m (Lower is a tighter competition).
Men’s 50m Freestyle: The gap efficiency deteriorated from 1.18% (2021) to 3.08% (2024). Improved raw times, while the relative gap between elite athletes and all others increased 161% (YoY data).
Why It Matters: Mere faster times are not a sign of progress. India’s sprint stars are leaving peers in the dust, and it’s a bad sign that the country could see a talent vacuum.
Women’s 50m Butterfly: Efficiency reverted (2.44% → 3.02%) with mixed depth but with no structured development — gains are temporary.
Key Metric: Reduction of the cumulative gap by event category (2021–2024).
Key Insights: 6% Cumulative Improvement: Enthusiasm dampened by numerical absurdity.
Takeaway:
India’s sprinters are getting faster but not deeper. If we don’t encourage mid-tier athletes, we will be left with only a handful of stars to cheer for.
Middle-Distance: The Silver Lining
Main Performance Indicator: Cumulative Gap Reduction (18% improvement seen in 200m/400m events)
Men’s 400m Freestyle: Their gap efficiency (2021–2024) had improved by 6% through pacing strategies and endurance coaching.
Women’s 200m Butterfly: Year-on-year gaps between better/best and worse/worst where their YoY gaps shrunk by 28%—the event with the most improvement. It likely helped that the swimmers received technical coaching on turns and underwaters.
Cumulative improvement of 18% — the most significant improvements owing to:
- Pacing strategy (e.g., Men’s 400m Freestyle).
- Coaching technical events (i.e. Women’s 200m Butterfly)
Takeaway:
India’s sweet spot: Middle-distance events. The technical skills focus here could serve as a template for other categories.
The Elephant in the Pool: Endurance Crisis
Key Metric: Year-on-Year Gap Regressions (Men’s 1500m gaps increased 86% in 2023)
Men’s 1500m Freestyle: Peak efficiency 13.07% (2023) — almost double the (2021) nadir
Women’s 1500m Freestyle: The Gaps spiked 123% (2023) — highlighting a lack of participation and resources.
Likely Root Causes:
Lose a lot of lactate threshold training.
Burnout from repeated training cycles
Less competition for long-distance swimmers.
Cumulative regression 2%: Systematic failure to hug again in the long-distance.
For example, 2023 also saw Men’s 1500m widening +86% gaps.
Takeaway:
When it comes to endurance swimming, India has an Achilles’ heel. With unscientific training, we’ll fall behind in marquee events like the Worlds or Olympics.
Gender Equity: Progress and Pitfalls
Women’s 200m Butterfly: A Gazing Star with -28% YoY gap closing.
Women’s 1500m Freestyle: Gaps increased by 123% (2023) — a chilling reminder of resource inequities.
Men: Middle-distance dominance, but sprint collapse.
Women: The more things change, the more they stay the same in endurance, but major prospective breakthroughs in technical [e.g. 200m Butterfly].
Takeaway:
Women’s swimming has more potential, but inconsistent investment is stifling growth.
The Story of Two Indias: The Radar Chart

1. Key Metrics Summary Table
Key Insights
Sprint Events:
🔴 Men’s 50m Freestyle: Gaps widened by +161%—elites dominate, mid-tier athletes lag.
🟢 Women’s 50m Backstroke: Gaps halved (-50%) due to improved technique.
Middle-Distance:
🟢 Men’s 400m Medley: Gap reduced by -69.5% (technical training success).
🟢 Women’s 200m Breaststroke: -46% gap reduction (consistency in pacing).
Endurance Crisis:
🔴 Women’s 1500m Freestyle: Gaps spiked by +123% (2023) due to training neglect.
🟢 Men’s 800m Freestyle: Improved by -43.4% (2024 focus).
Gender Trends:
Men: Strong in middle-distance (-37.9% in 200m Butterfly) but collapsing sprints.
Women: Progress in technical events (-41.9% in 100m Backstroke) but endurance gaps persist.
Gap Efficiency Trend Chart: Purpose: Compare competitiveness trends normalized by event distance.
International Context: Where India Stands with the U.S:
One undeniable trend is evident from the resulting 2022 US International Swimming Trials photo finish, the distance from 1st to 8th place was nearly halved in 2016 sprint finishes. See my “X” post on this. My Twitter Post
🏊♂️ Why Are US Gaps Smaller?
Talent Depth: US trials pool 50+ elite swimmers per event, India’s 10–15
Technical Emphasis: US coaches put the most weight into race-simulations (underwaters, turns) drills that close gaps.
Data-Driven Training: Wearables record stroke efficiency and facilitate marginal gains
India could do likewise with youth academies and organs of sports science.
“I think the 2022 US trials showed that smaller gaps do not equal slower swimming—smaller gaps mean more athletes are swimming to elite standards.” — @DataDrivenMed
What’s Next?
1. Fix the Sprints: Give opportunities for 50m/100m sprinters.
2. Race-simulation drills to close reaction-time gaps.
3. Overhaul Endurance: Learn to partner with sports scientists for altitude training.
4. Generate a national cross-country race circuit.
5. Fill resource gaps between men’s and women’s programs.
Actionable Recommendations
For Coaches:
Sprint Events:
1. Add race-simulation drills to narrow reaction-time gaps.
2. Benchmark against Asian rivals (e. g Japan 50m Freestyle efficiency: ~1.5%)
Endurance Events:
1. Consult sports scientists for altitude training and lactate threshold optimization.
2. Hold national-level long distance camps to increase participation.
Women’s Technical Events:
1. Focus 200m Butterfly and 200m Medley—these demonstrate progressive enhancement.
General:
1. Correlate Gaps with Training: Utilize metrics and wearables to aggregate gaps to stroke rate, turns etc.
2. Set international targets: Benchmark Indian gaps against Olympics/World Championships data.
3. Invest in Youth camps.
Final Macro Insight
India is enjoying "swim inflation" in technical and middle-distance events, yet endurance swimming is undergoing a crisis. To become a global contender:
1. Increase sprints 50m/100m– talent ID programs
2. Train hard with data-based endurance practices.
3. Use women’s progress in 200m Butterfly as a template for other events.
Final Thought
India’s “swim inflation” is a thing—but an uneven one. While the middle-distance events are the stars, the endurance and the sprints seem to dangle. The data isn’t merely a warning; it’s also a roadmap. With this focus on training and equity, India could move from a regional player to a global competitor.
If You Want to Dive Deeper: The raw data and metrics, as well as the methodology, can be found in my earlier post on my Substack:
Welcome to the Data Driven Revolution in Swimming- 3 part series
I. Introduction: No Longer the Sound of the Crowd